Visualizing Palestine Infographics
I have worked as a partner with Visualizing Impact since its founding in 2012. Since the beginning, our flagship project has been Visualizing Palestine, through which we aim to harness data-led visual storytelling as a means to empower changemakers to communicate on the complex and politically sensitive rights-based issues.
Over this period, we have developed all manner of visual tools and digital platforms for use online and offline, but our core work has remained in infographics. Our visuals have won international awards, have been featured in numerous printed publications, and have been downloaded and printed by our community for presentations and exhibitions in over 40 countries.
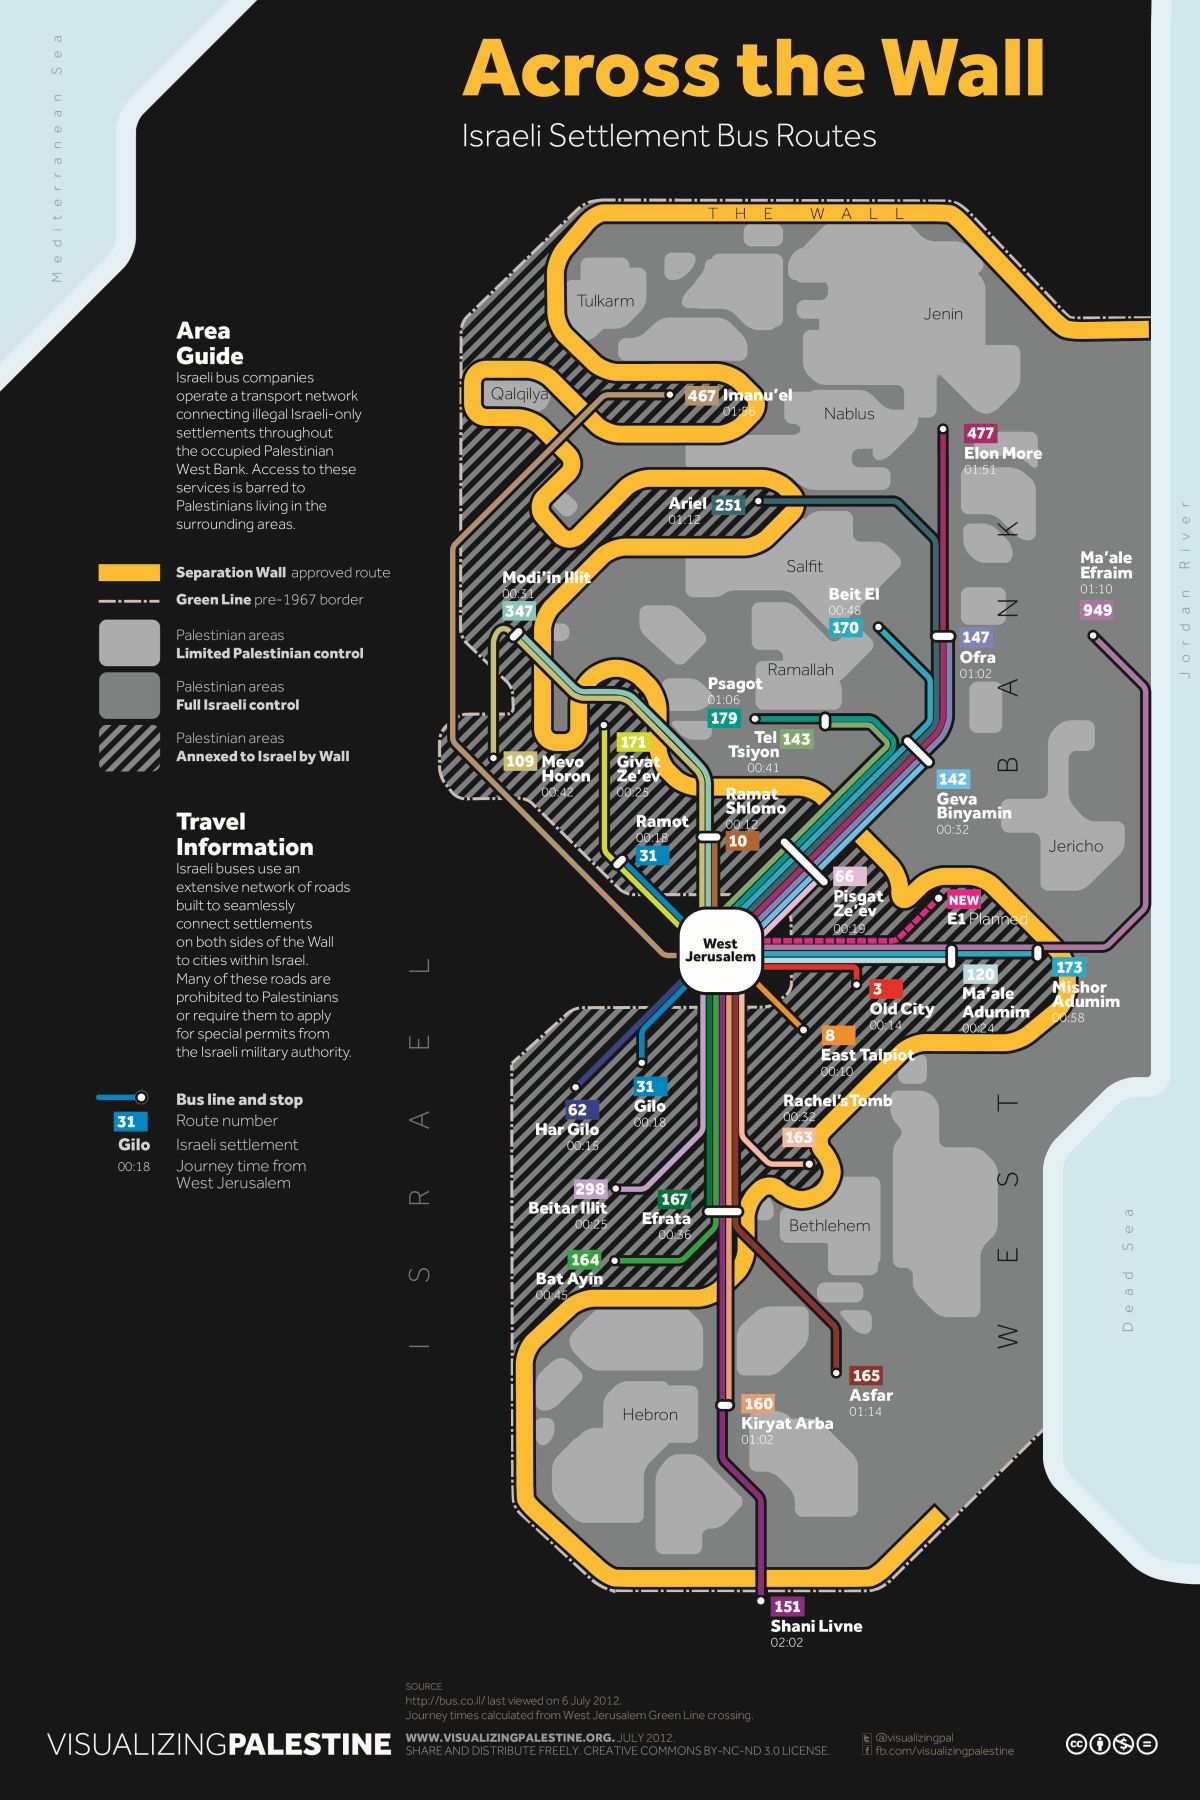
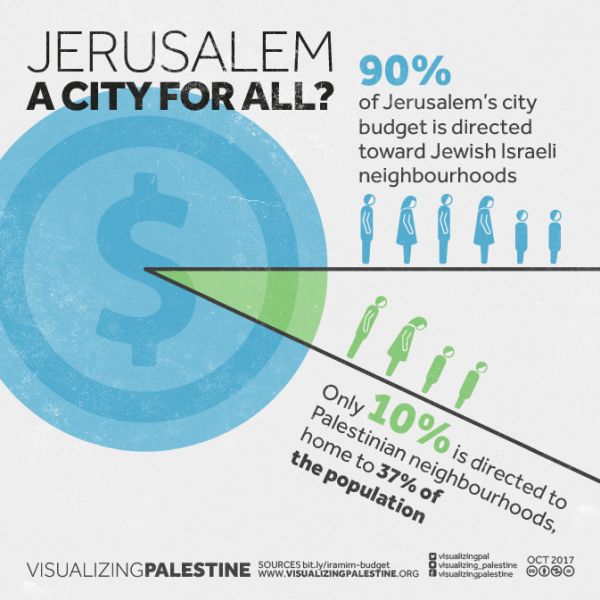
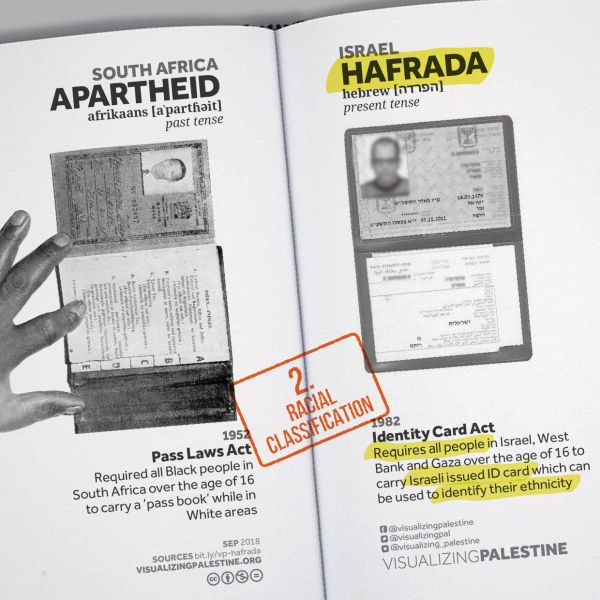
Infographic poster: Research, information design and copywriting by Ahmad Barclay. Graphic design by Polypod.
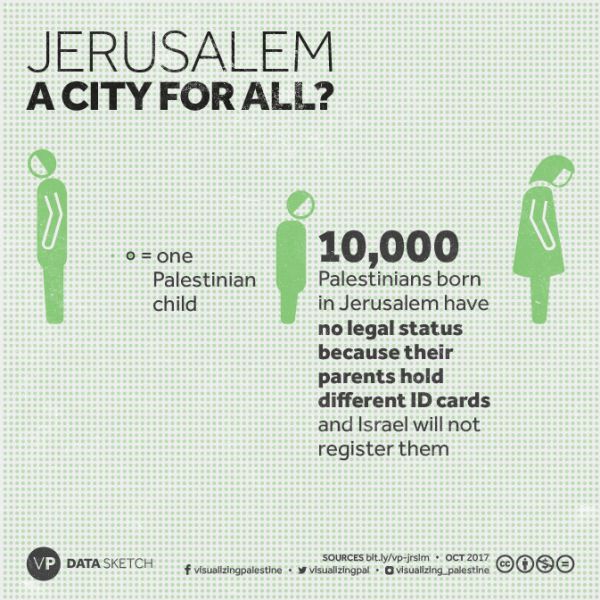
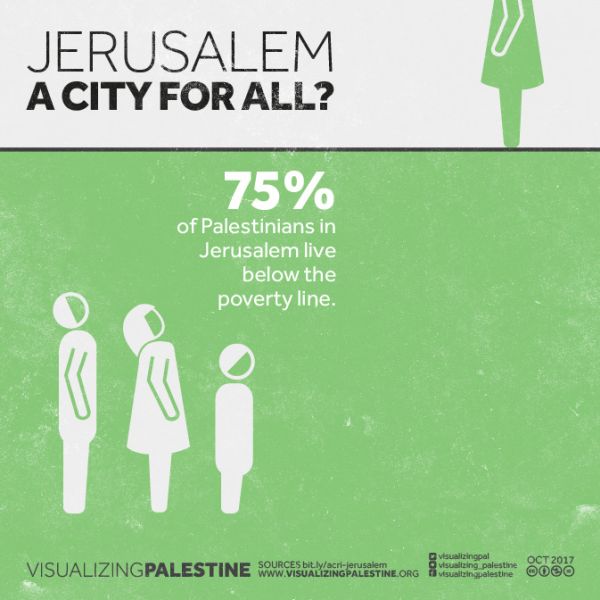
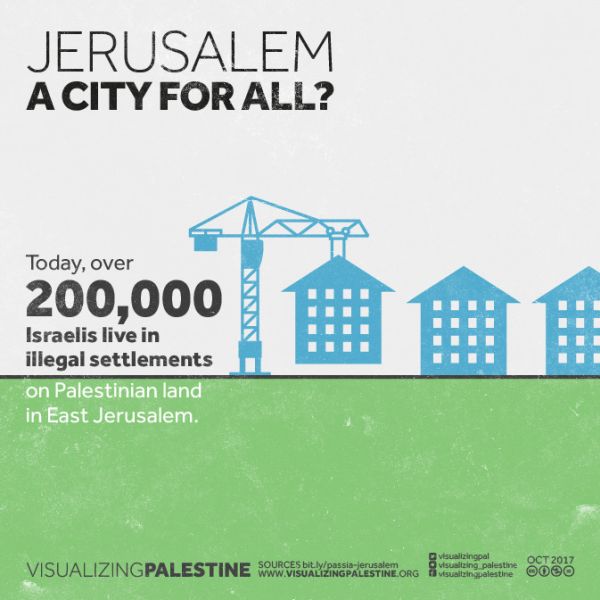
Mobile infographics: Design and copywriting by Ahmad Barclay. Research by VP team.
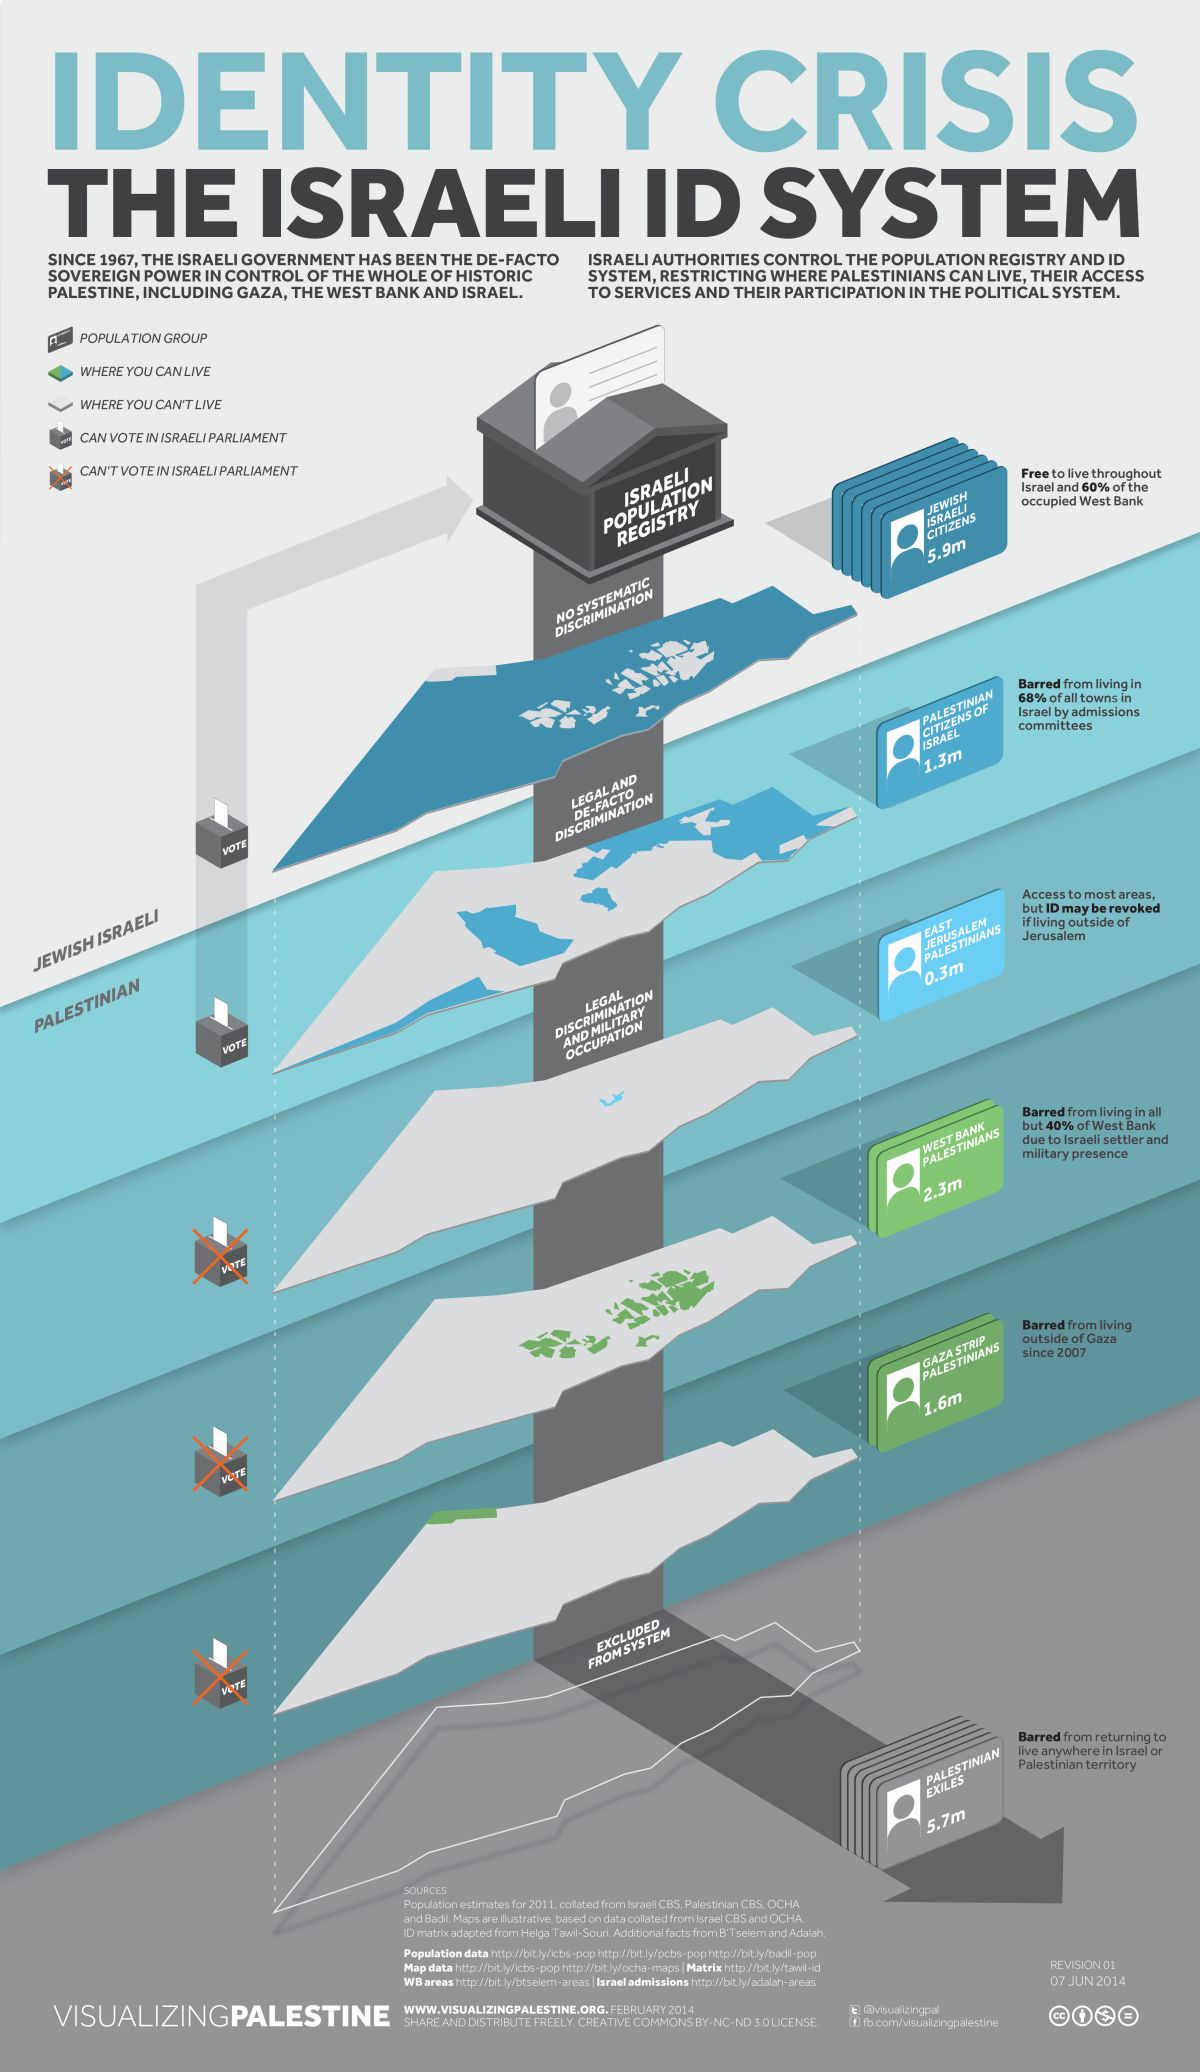
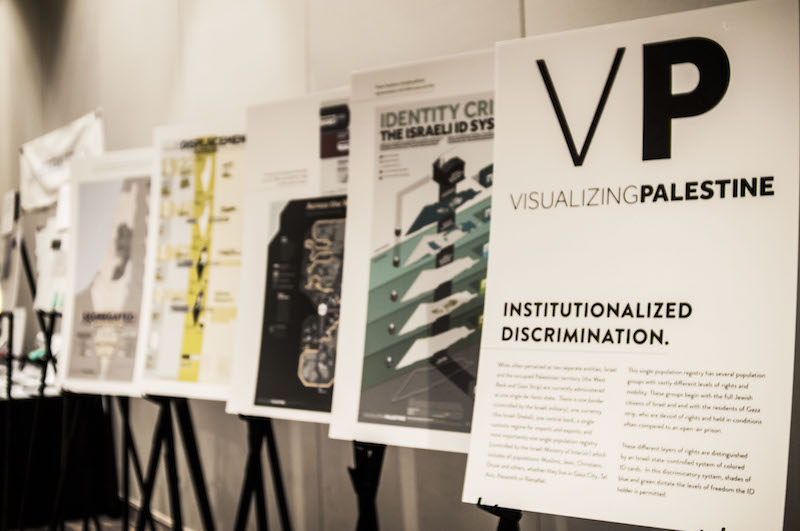
Infographic poster: Research, information design and copywriting by Ahmad Barclay. Graphic design by Conor McNally.

Mobile infographics: Design and copywriting by Ahmad Barclay. Research by VP team.
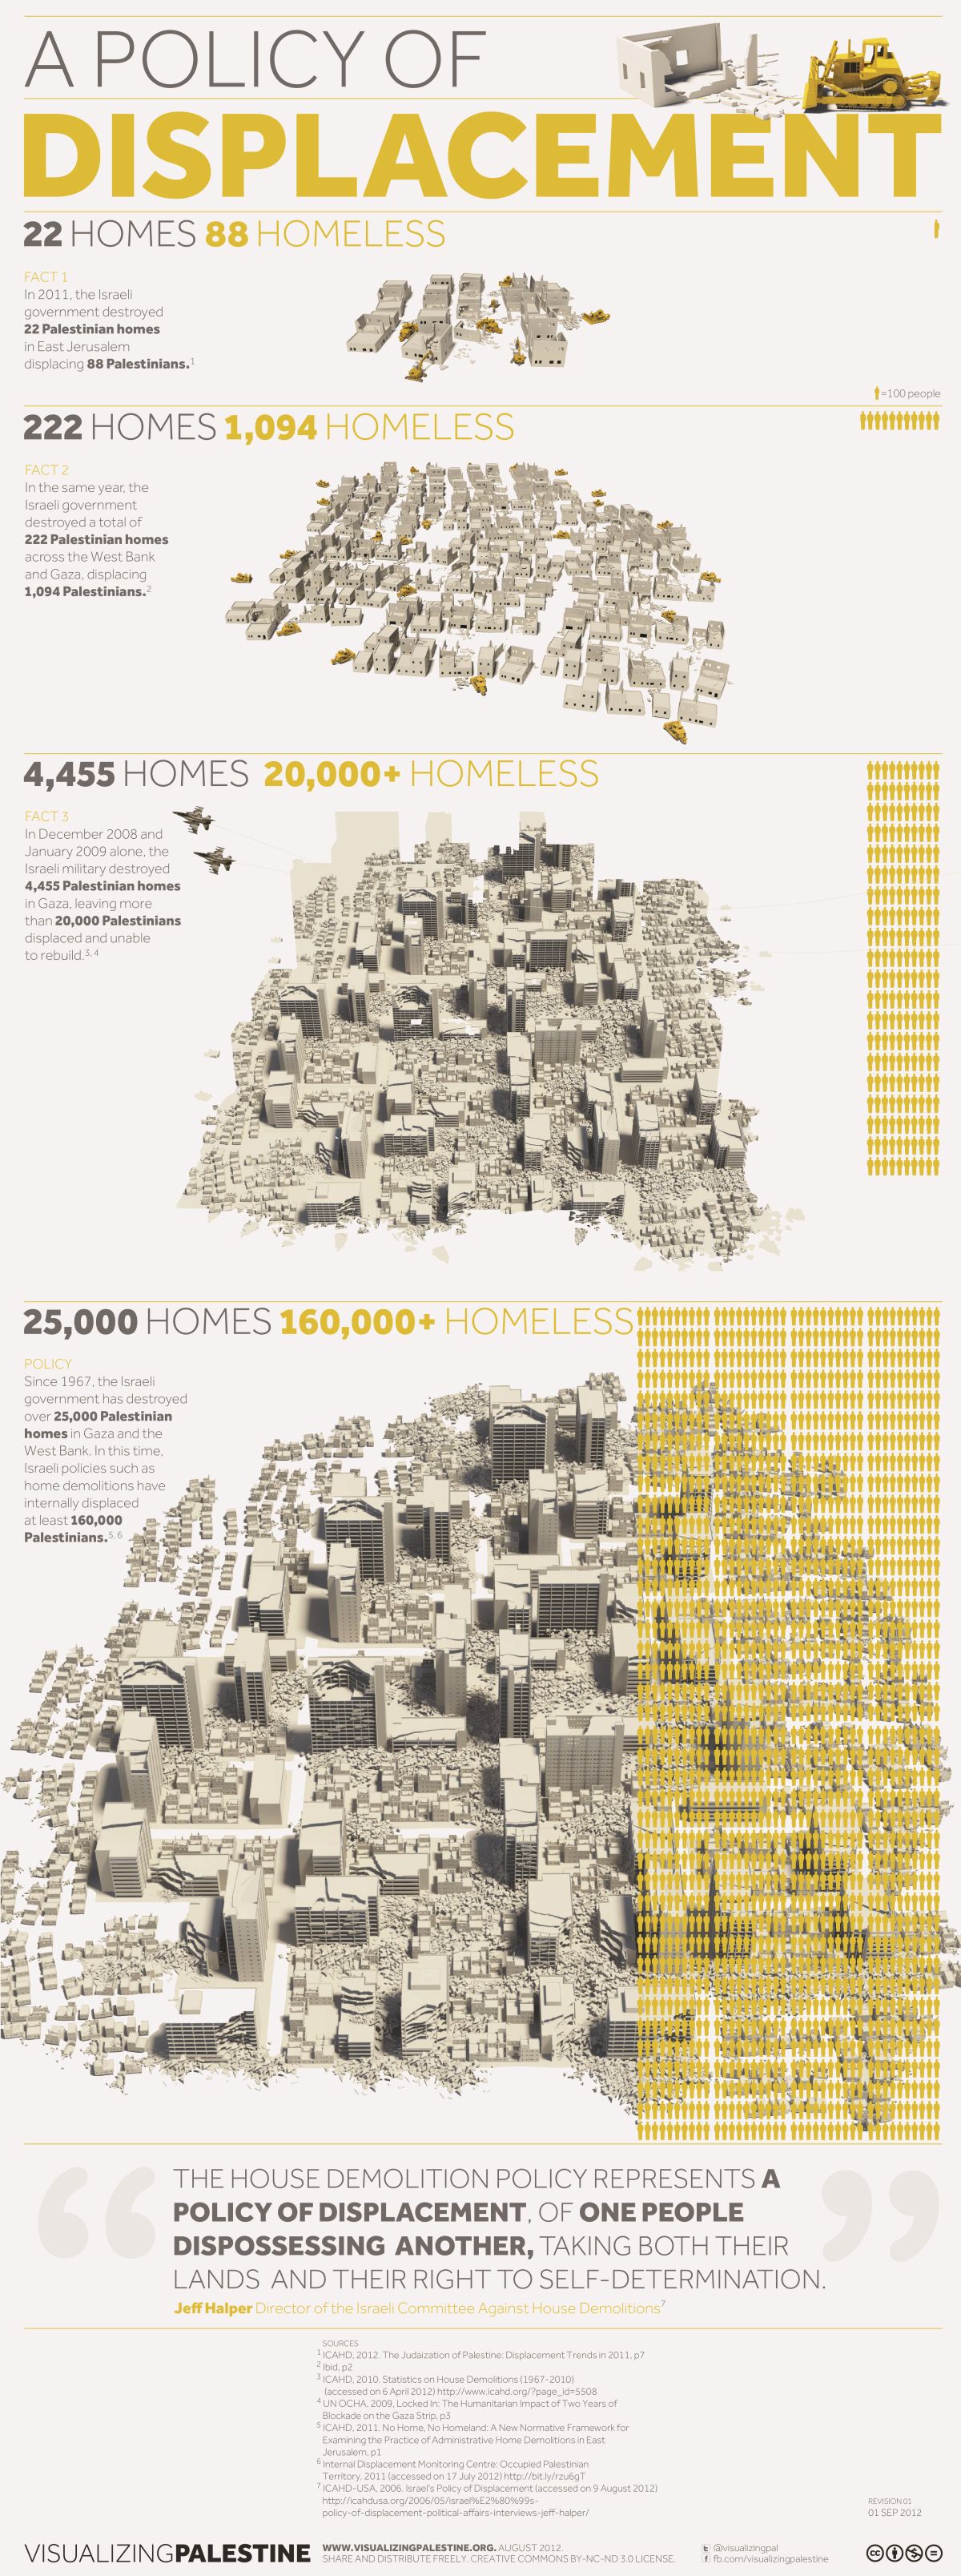
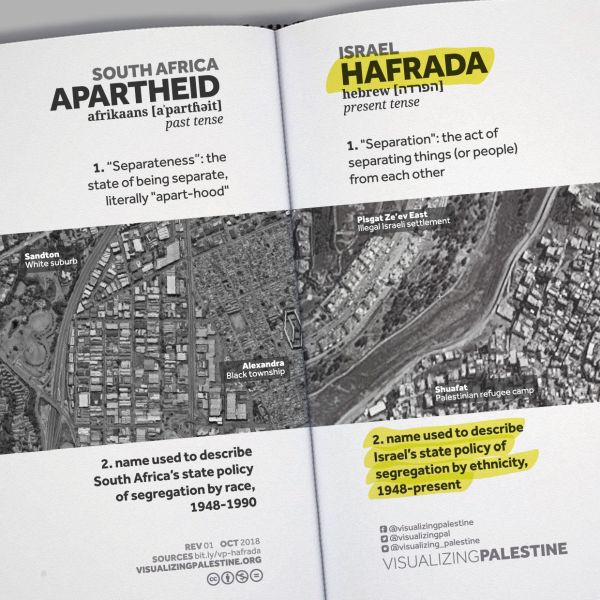
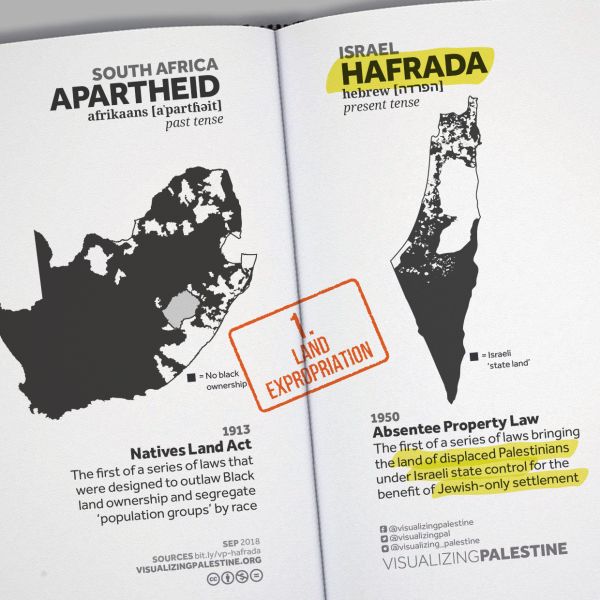
Infographic poster: Research, information design and copywriting by Ahmad Barclay. Graphic design by Conor McNally.
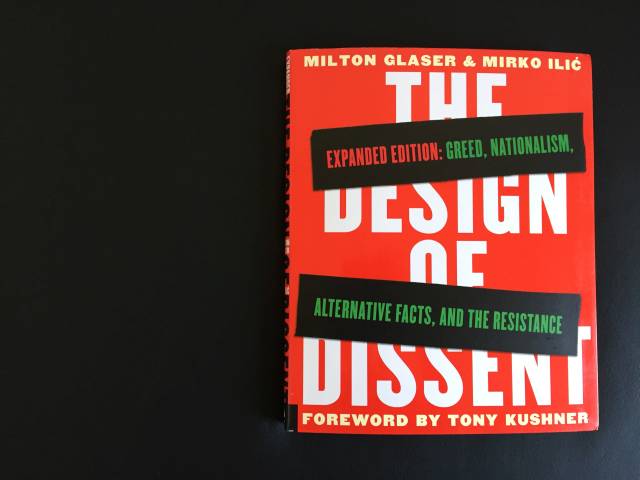
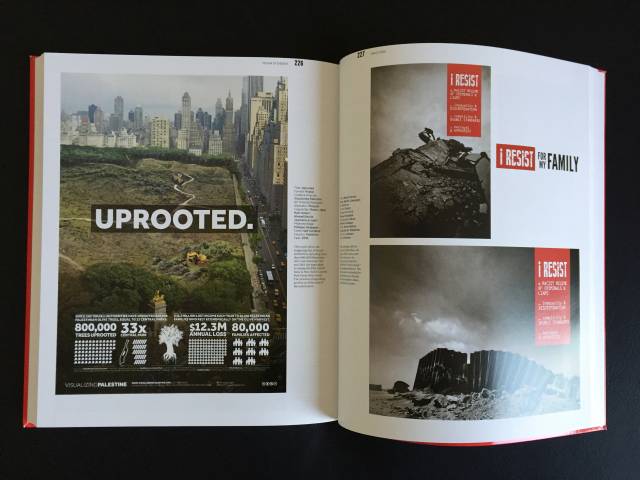
Featured in The Design of Dissent, by Milton Glaser et al., 2017.
Exhibited at the national conference of Jewish Voice for Peace, USA, 2015.

Featured as infographic of the day on Fast Company Co.Design, 2012.
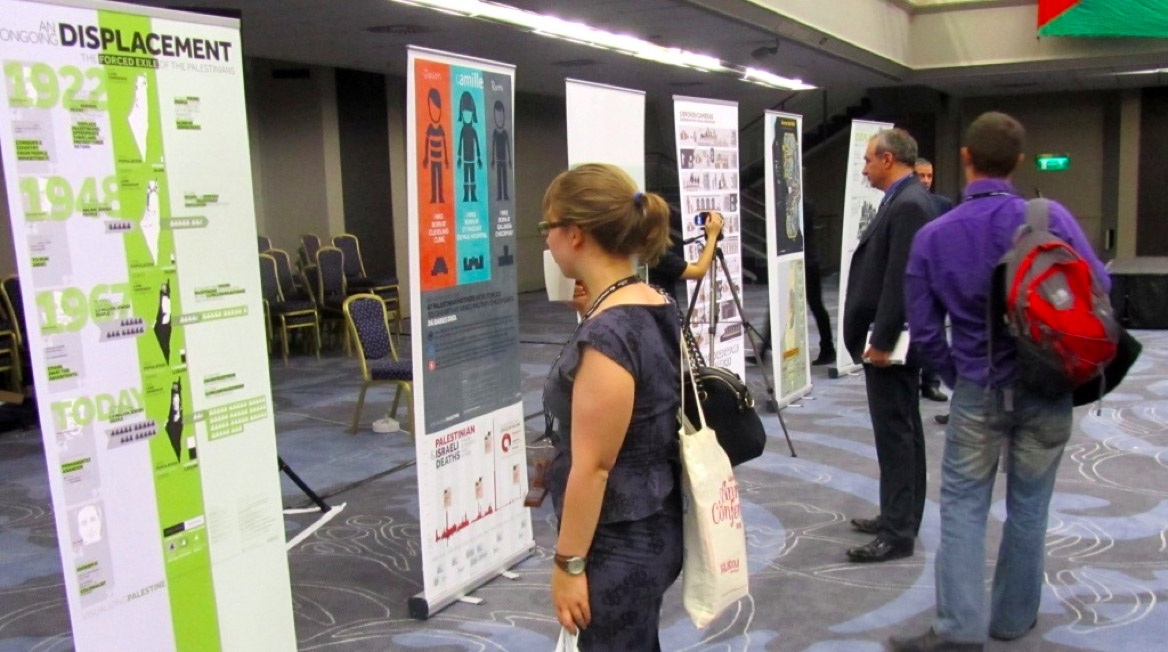
Exhibited at the national conference of the UK Labour Party, 2014.